High-fidelity multi-physics simulations of CRUD deposition on fuel rods
Project Description
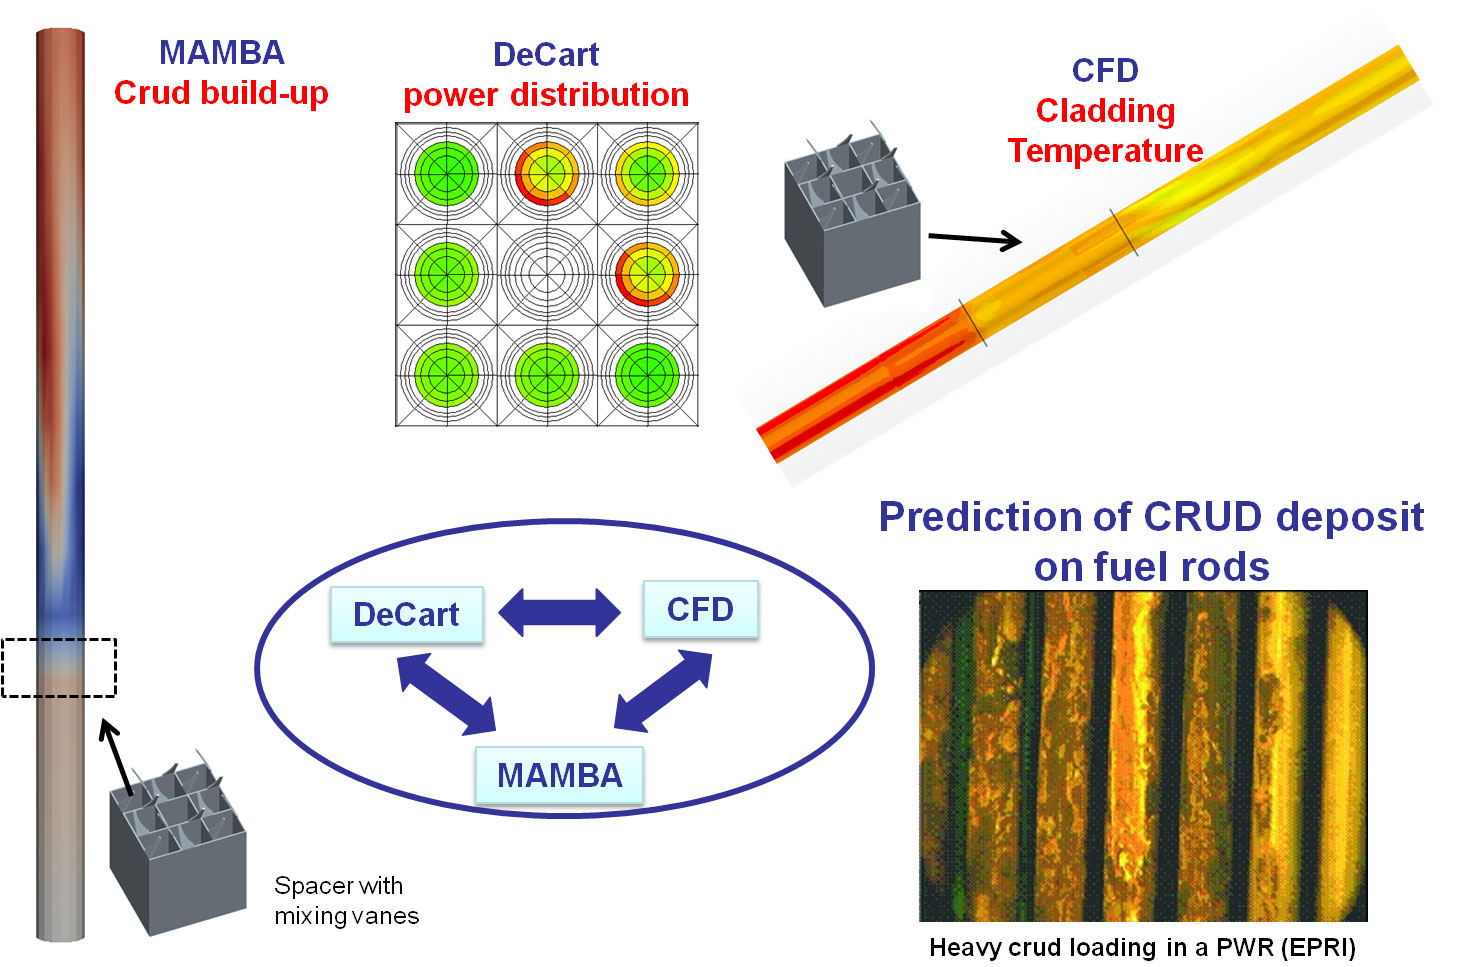
The operational issues that arise due to CRUD (Chalk River Unidentified Deposit) build-up on PWR fuel pins include CRUD induced power shift and CRUD induced localized corrosion, known as CIPS and CILC, respectively. These phenomena lead to reduced operating margin and compromised fuel rods. In collaboration with Los Alamos National Laboratory (Dr. Brian Kendrick), we have developed a two-way coupling between the neutron transport code MPACT, the CFD code STAR-CCM+ and the CRUD chemistry code MAMBA. With this novel high fidelity coupled tool we are able to reproduce the classic “striped” CRUD pattern observed on fuel rods in operating reactors.
Multi-pins simulations
The MIMIC interface was extended to include the neutron transport code MPACT, developed at the University of Michigan. Simulations for sub-assemblies including grid spacers and mixing vanes were performed. Details of a 5×5 model of a Westinghouse Sebrook power plant sub-assembly are shown in the figure.
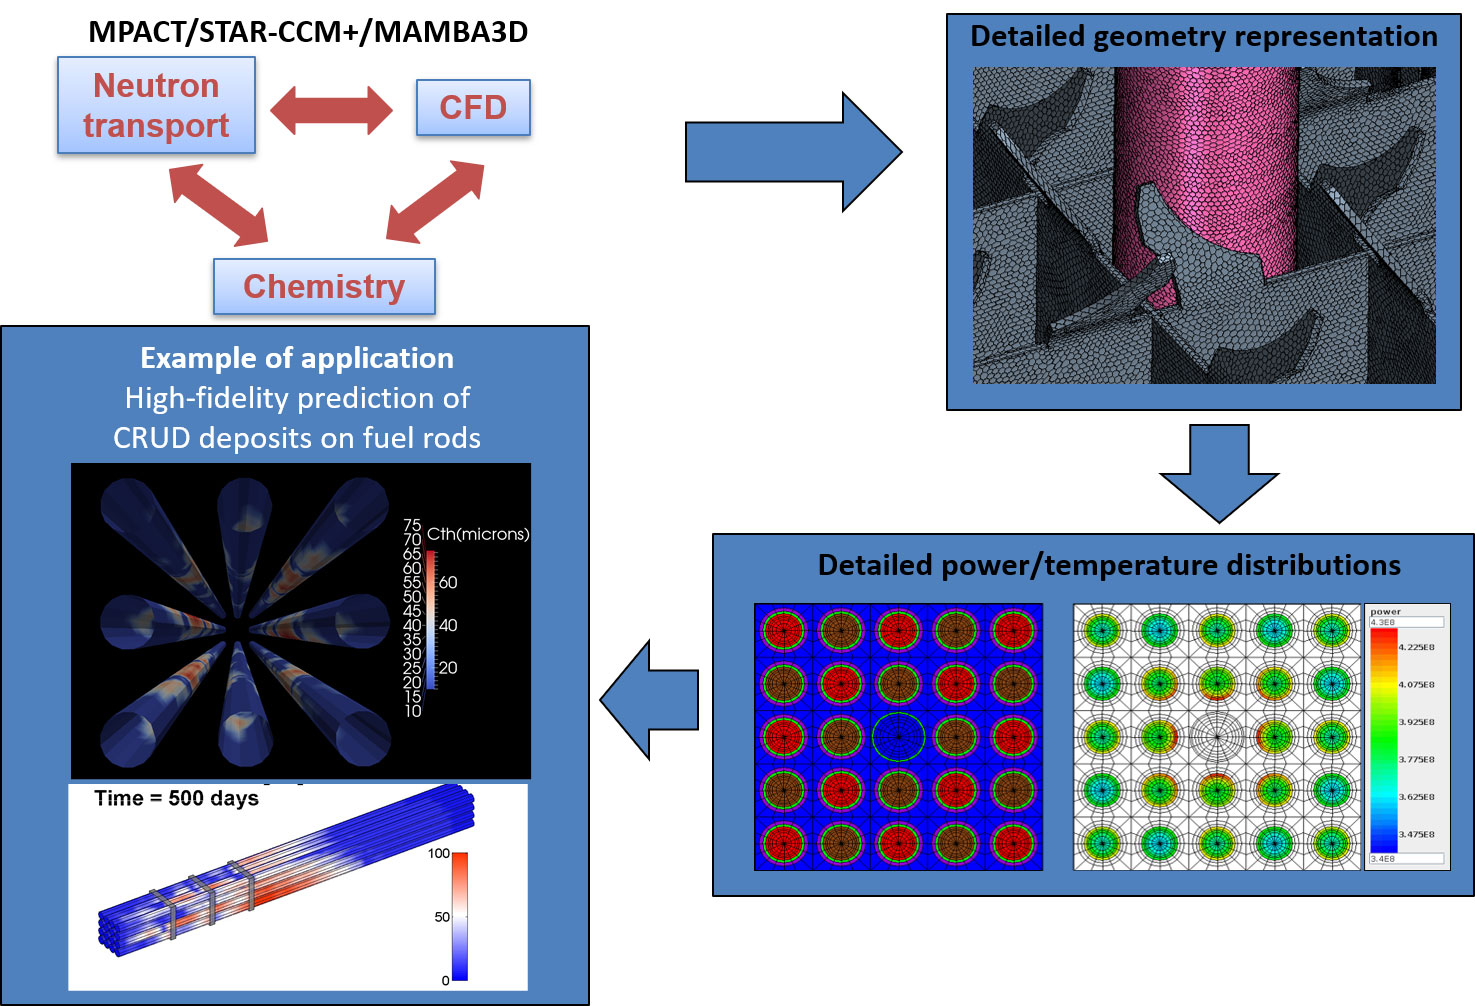
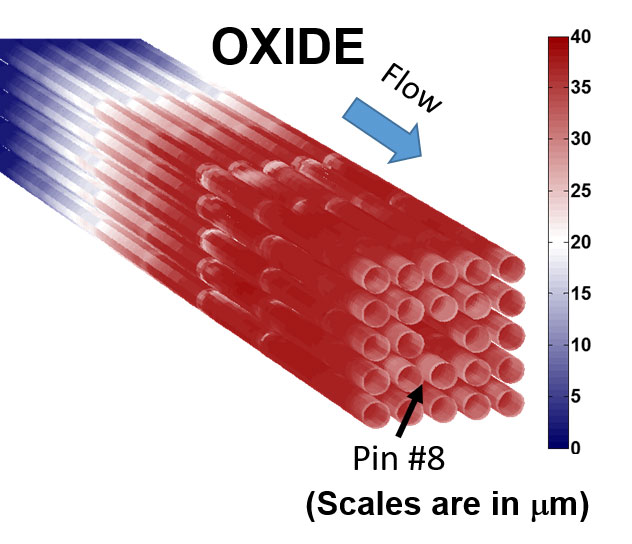
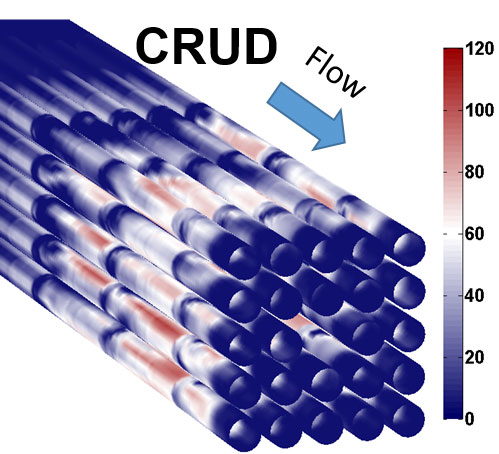
Both CRUD deposit and oxide layer growing on the fuel cladding surface during the depletion cycle were calculated.
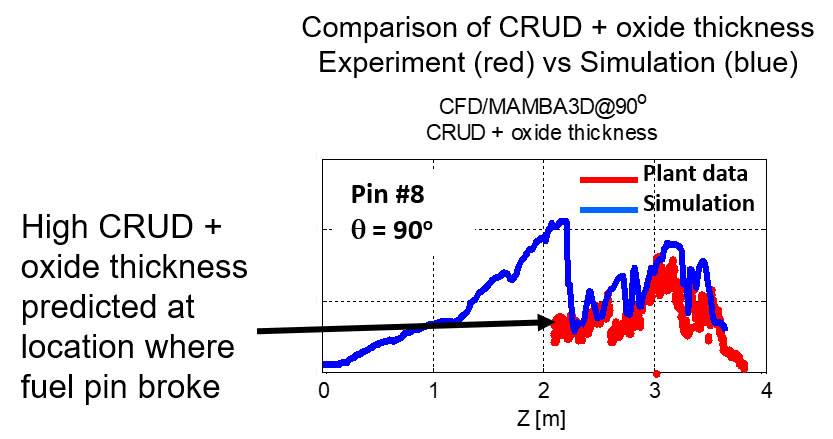
Comparison with actual plant data has shown a very good agreement with simulation results. In figures 1 and 2 below the CRUD + oxide layer as function of pin height are shown for one of the plant failed pins, at a specific azimuthal angle.